What are we up to today?
Some beautiful paths can’t be discovered without getting lost.
- Erol Ozan
A while ago a friend of mine and I got lost after trying to make sense of the post What is the roundest country? from Gonzalo Ciruelos’ blog. It had already been around for a few years at that point but the images from it were going around on social media and we had a laugh at it. We wondered how someone could have come to ask that question and wanted to make some funny response to it.
We boiled down the “roundest country” question, as Ciruelos asked it, to “which country would make the best wheel?” Maybe we could make a respond with “which country would make the best ball bearing?” But then my buddy told me we had been going about this all wrong! Why try to find which country would roll the smoothest on a flat road when we could instead find which road could fit a country such that it would feel like a smooth ride?
Think in the case of the US. If you had a car with America shaped tires, what would the road have to be shaped like for you to have a smooth ride? Here’s how I tried to calculate America’s perfect road, Route 66.
Data and Loading
Like Ciruelos, I used the Natural Earth sovereign states dataset. It gives you a .shp file that contains a set of sequences of points for each country. Each set represents a contiguous part of the country and when the sequences of points in each part are connected they create a polygon in the shape of the country.
I learned how to read .shp files with pyshp and manipulate them with shapely by following Ciruelos’ code in the original post. It works like this:
# After necessary imports and path linking...
dat = shapefile.Reader(INPUT_FILE)
meta = dat.records()
countries = dat.shapeRecords()

# Use Natural Earth records to pull country by name
name_list = []
for rec in meta:
    name_list.append(rec[3])
by_name = dict((name, num) for num, name in enumerate(name_list))
coi = countries[by_name['United States of America']]

# And then plot
coi_wrong = Polygon(coi.shape.points)
wrong_x, wrong_y = coi_wrong.exterior.xy
plt.plot(wrong_x, wrong_y)
plt.show()

This plots the entire country, but I would rather have one contiguous part of it. In the original post, Ciruelos selects the largest part of the country. I found that the largest part is generally the first, so I just chose that instead.
mainland_points = coi.shape.points[coi.shape.parts[0]:coi.shape.parts[1]]
coi_poly = Polygon(mainland_points)
coi_poly = shapely.affinity.translate(coi_poly,
                                      xoff=-coi_poly.centroid.x,
                                      yoff=-coi_poly.centroid.y)
x, y = coi_poly.exterior.xy
plt.plot(x, y)
plt.scatter(coi_poly.centroid.x, coi_poly.centroid.y, c='red')
plt.show()

Now that we have the mainland US free to mess around with, how do we get it to roll?
The Proper Solution
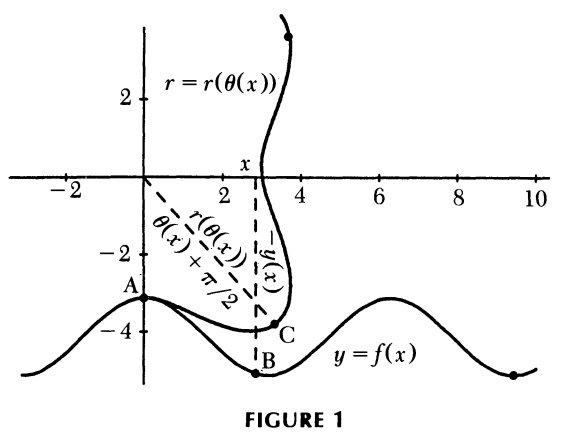
In my (brief) research on the topic of roads and wheels, I found this aptly named article by Leon Hall and Stan Wagon, Roads and Wheels. In it, they address pretty much the same problem I’m working out right now. They have a shape and they want to build a road it will roll smoothly on (also the converse, they have a road and they want a shape that can roll smoothly on it). They define the problem with these conditions:
- The road can be described as a function
f(t) = (x(t), y(t))such thatx(t) < x(t + 1)andy(t) <= 0 - A wheel can be described as a polar function
r = r(t) - The center of rotation on the wheel is always directy above the contact point with the road.
- The distance unraveled on the wheel matches the distance traveled along the road.
- The depth of the road matches the radius of the wheel at every corresponding point.
With the problem so defined, the authors were able to make roads like this:
Looks complicated!
If I wanted a graph this nice, I’d need to describe America with a polar function. I tried to do this by tracing each point in the polygon and getting it’s distance and angle from the centroid, along with it’s distance from the previous point.
t = []
x = []
y = []
ini_theta = None
min_theta = 0
ctr = np.array(coi_poly.centroid.coords)
for i, pt in enumerate(coi_poly.exterior.coords):
    theta = np.arctan2(pt[1], pt[0]) * 180 / np.pi
    dist = np.linalg.norm(ctr - np.array(pt))
    if i == 0:
        ini_theta = theta
        t.append(theta)
        x.append(0)
        y.append(dist)
    elif i == 1:
        t.append(theta)
        a = np.array(mainland_points[i - 1])
        b = np.array(mainland_points[i])
        x.append(np.linalg.norm(a - b))
        y.append(dist)
    elif theta > ini_theta:
        theta = theta - 2 * 180
    else:
        t.append(theta)
        a = np.array(mainland_points[i - 1])
        b = np.array(mainland_points[i])
        x.append(np.linalg.norm(a - b))
        y.append(dist)
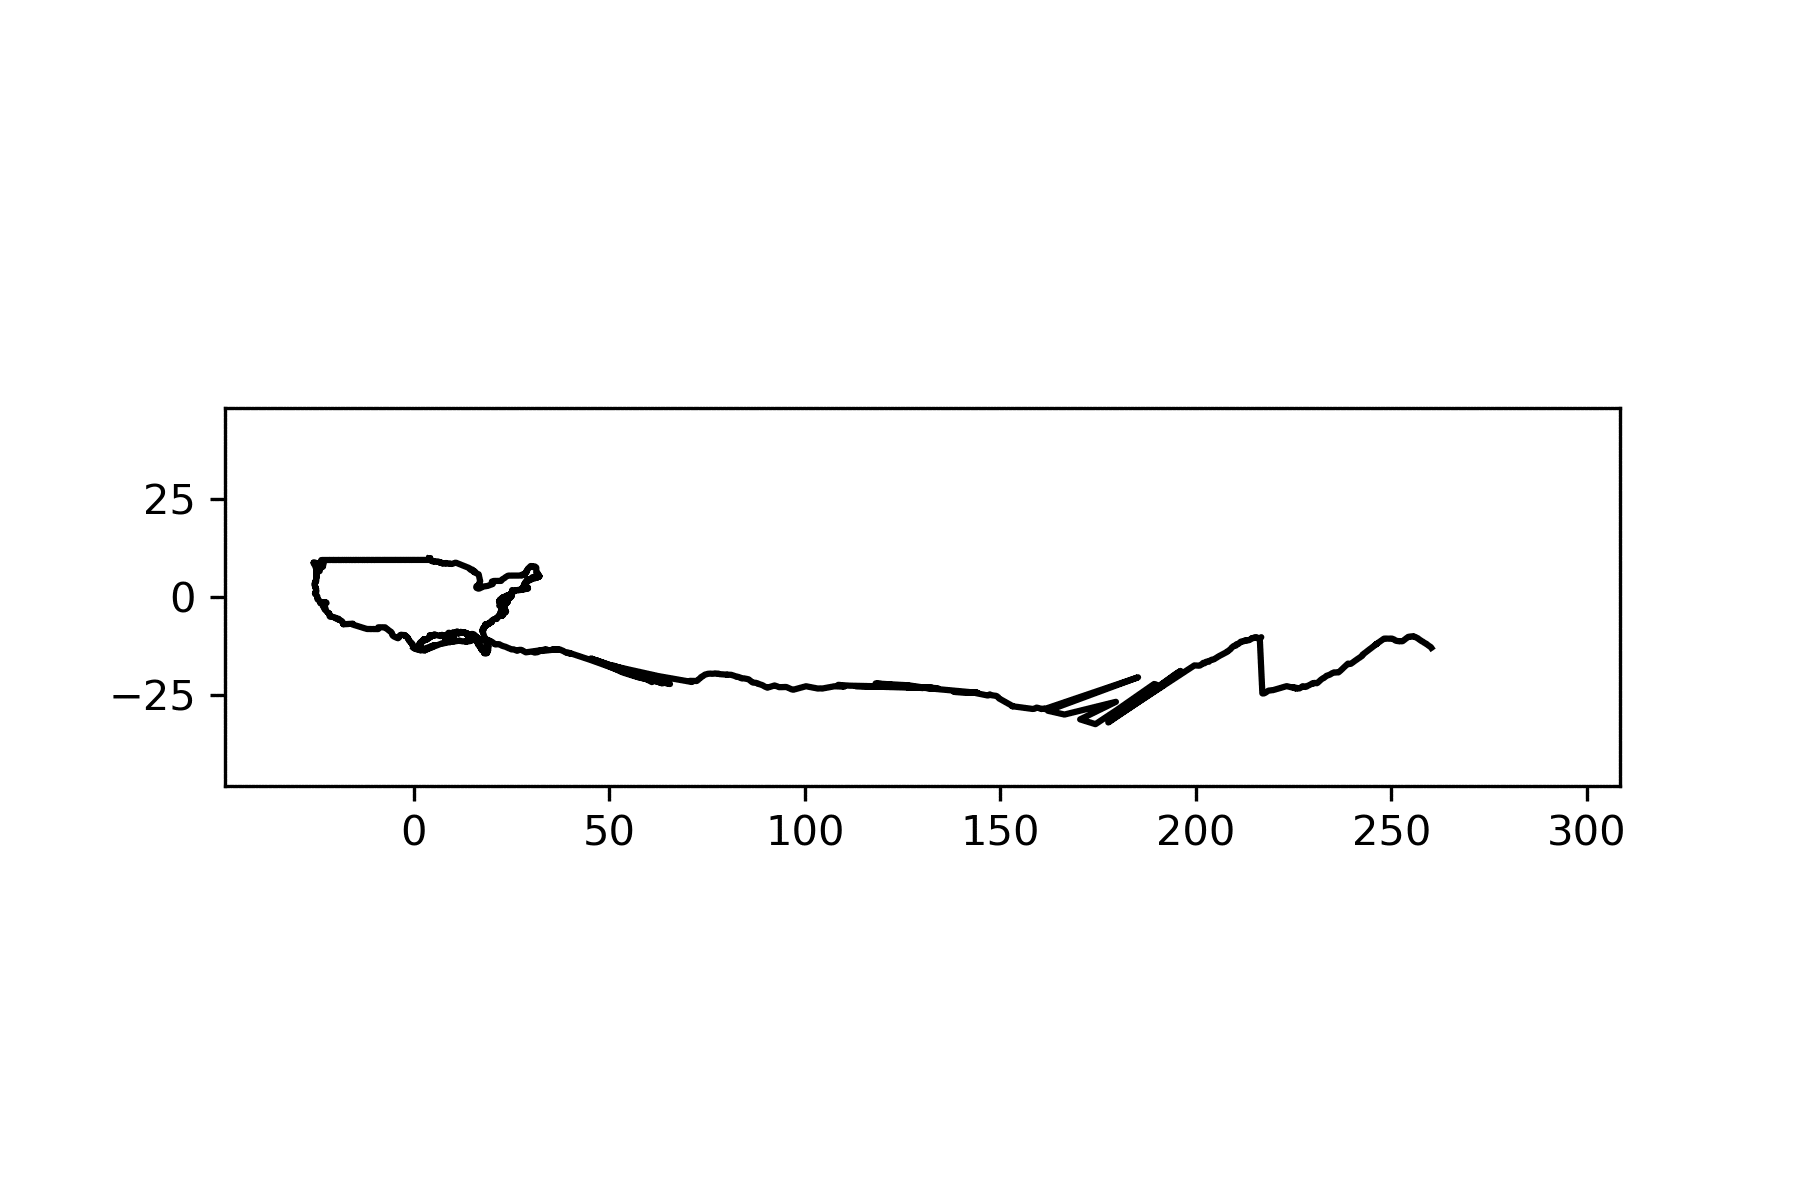
This is my naive attempt at doing that. The extra if statement you see is to try to prevent backtracking degrees to make the interpolation look smoother. You’ll see that in a second. This gives me all the information I needed to know about the wheel and the road in terms of t.
Since x is the distance between any two points on the border of the country, its cumulative sum should be the displacement at angle t. Since y is the distance from the centroid of each point, it should be the depth of the road at angle t.
plt.scatter(x.cumsum(), y, c=t, s=1)
plt.show()

All according to plan, right? Well, not really. This road starts from the first point in the .shp file’s list (which seems to just be the northernmost point on the border). I need to use a function like this to identify the starting point of the road, and adjust it accordingly:
def nearest(arr, val):
    idx = (np.abs(arr - val)).argmin()
    return idx

start = nearest(data[0], -90)

There! Now to just slide the road back and make some adjustments the t parameter array (which I’ve squeezed into a big matrix called data) and we’re ready to define a function! We’ll plug it in to scipy’s interpolate function so that we can estimate displacement and depth at any angle.
f = interpolate.interp1d(data[0], data[1:])
This function should satisfy Hall and Wagon’s conditions. With only a degree angle as input, I can get both the distance along the border and the current depth of my wheel and, consequently, the current distance and depth of my road. When I put it all together though, it looked like this…
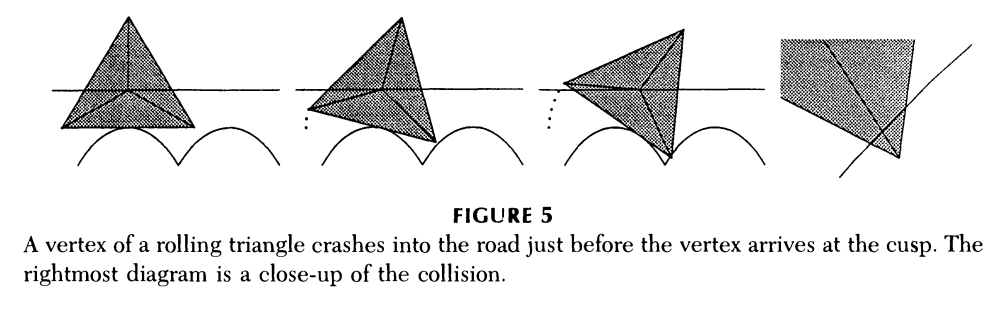
And though there are definitely some things I could polish up, collisions and jumping like this are to be expected. Hall and Wagon showed that with this method, some shapes have to collide with their road, like this triangle:
So, I decided that it was more important to make it pretty than to make it right and started a different approach.
The Cookie Cutter Solution
I immediately put in place an assumption that the country would both rotate and translate at a constant rate. This was both to reduce the amount of thinking I’d need to do but also to guarantee that whatever I came up with would make a smooth animation like this one from the Wikipedia page for square wheels:
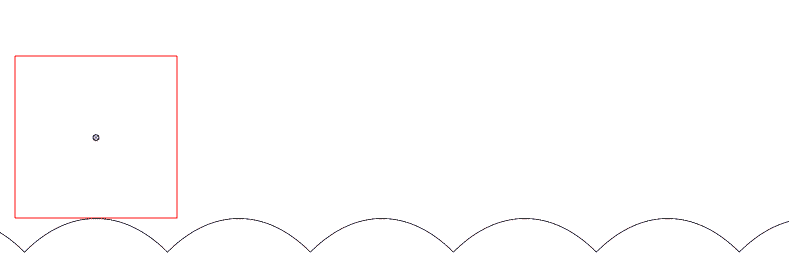
I decided how far the country would roll based on its diameter and a small penalty to minimize slipping based on the difference in the area of the country and its convex hull. Then, I used a loop like this to build the road:
road = Polygon([(0, 0), (coi_at(1).centroid.x, 0), (coi_at(1).centroid.x, -1.5 * lim), (0, -1.5 * lim)])

for i in np.linspace(0, 1, PRC):
    c = coi_at(i) # This method gets the position of the country at any point in the rotation
    road = road.difference(c)
And voila! An America-shaped wheel rolling smoothly on an America-shaped road!
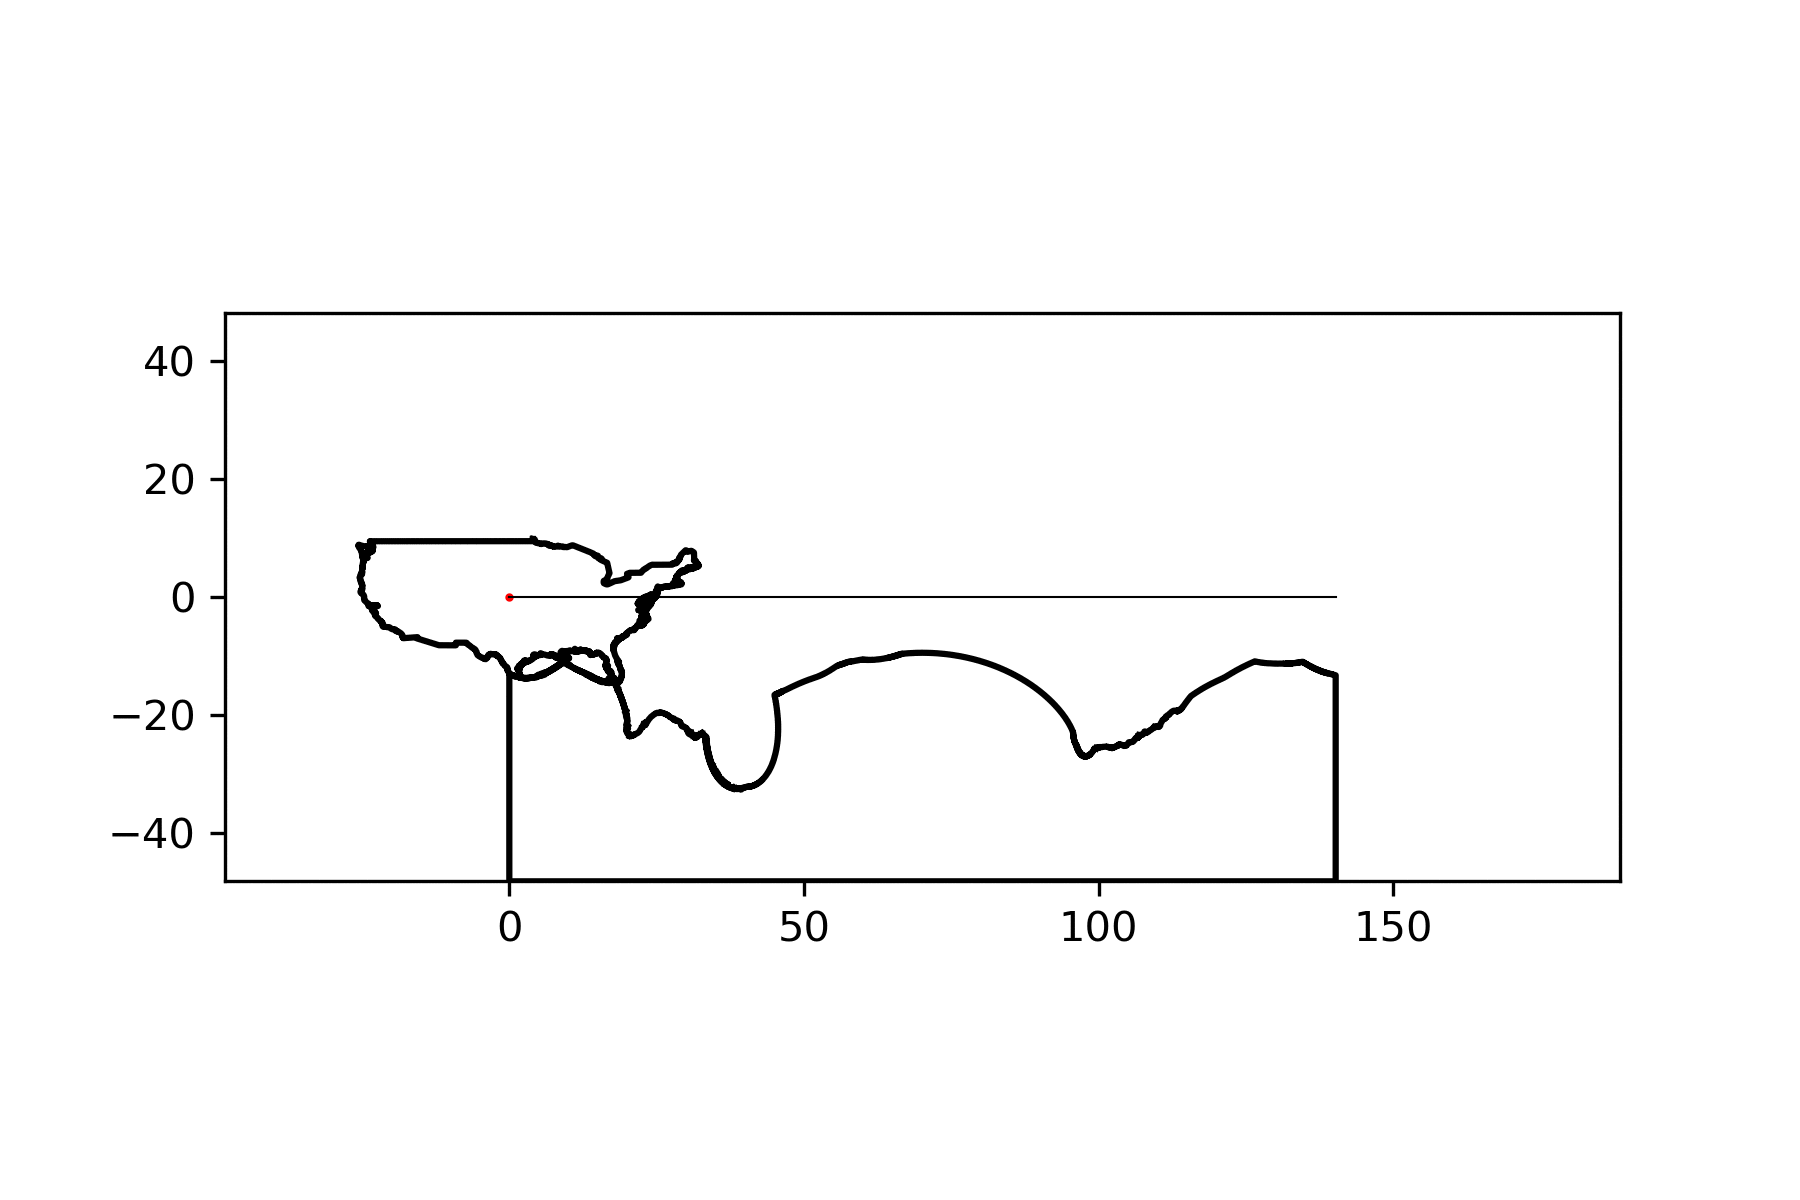
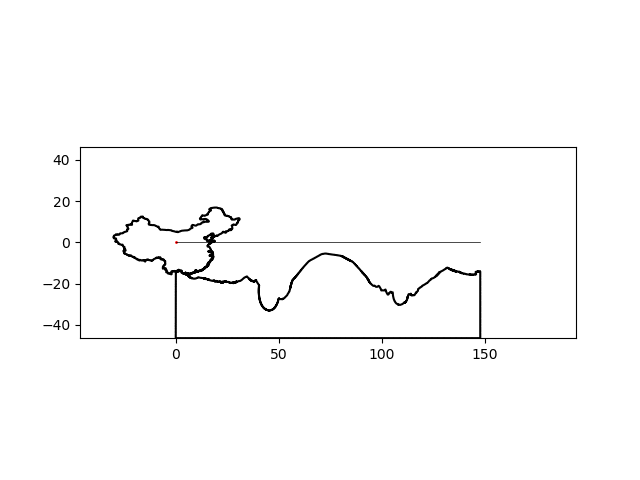
There’s a noticeable lack of traction at some points but I think I can suspend my disbelief this much for this particular project. By simply changing the name of the country of interest, I can make a similar graphic for any country:
| India | China |
|---|---|
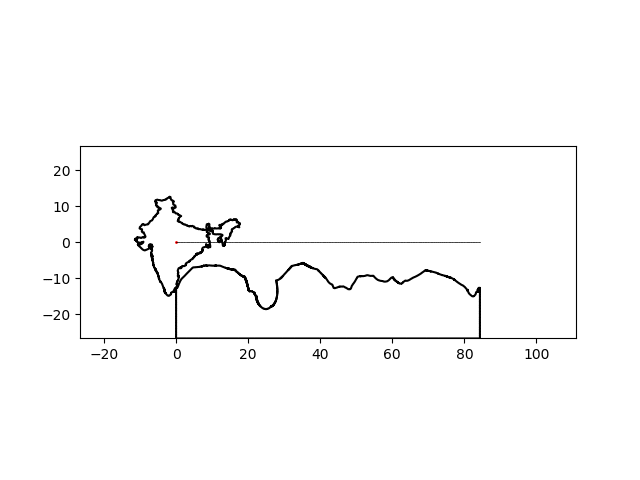 |
 |
| Colombia | Sierra Leone |
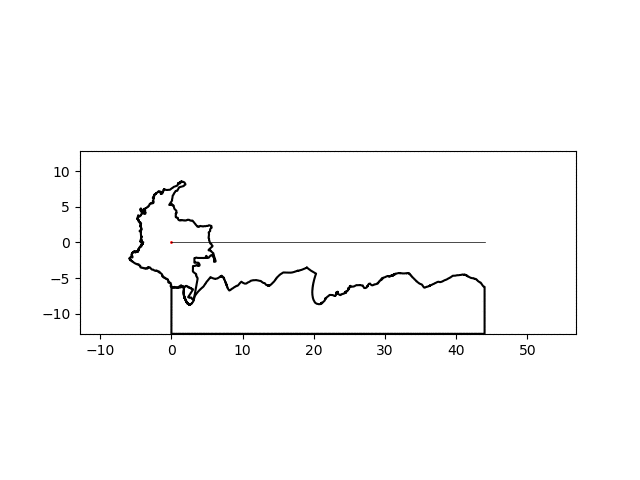 |
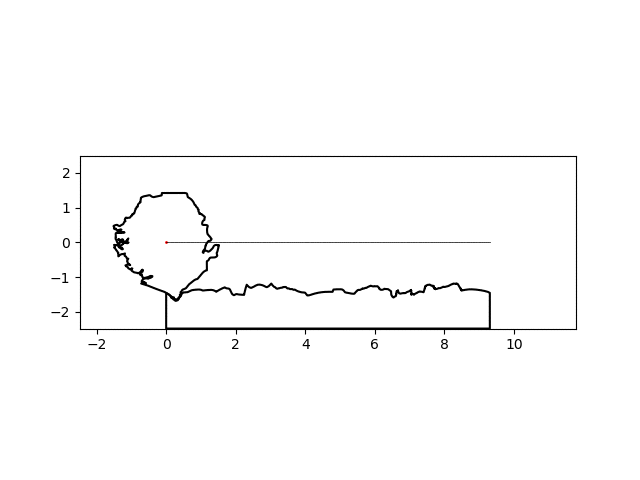 |
If you want to try it yourself, I’ve made the useful portions of code available as a gist that I’ve embedded below. Just be sure to download the Natural Earth dataset and link it to the script properly.
Thanks,
Blake